|
||
|
|
|
|
||
|
|
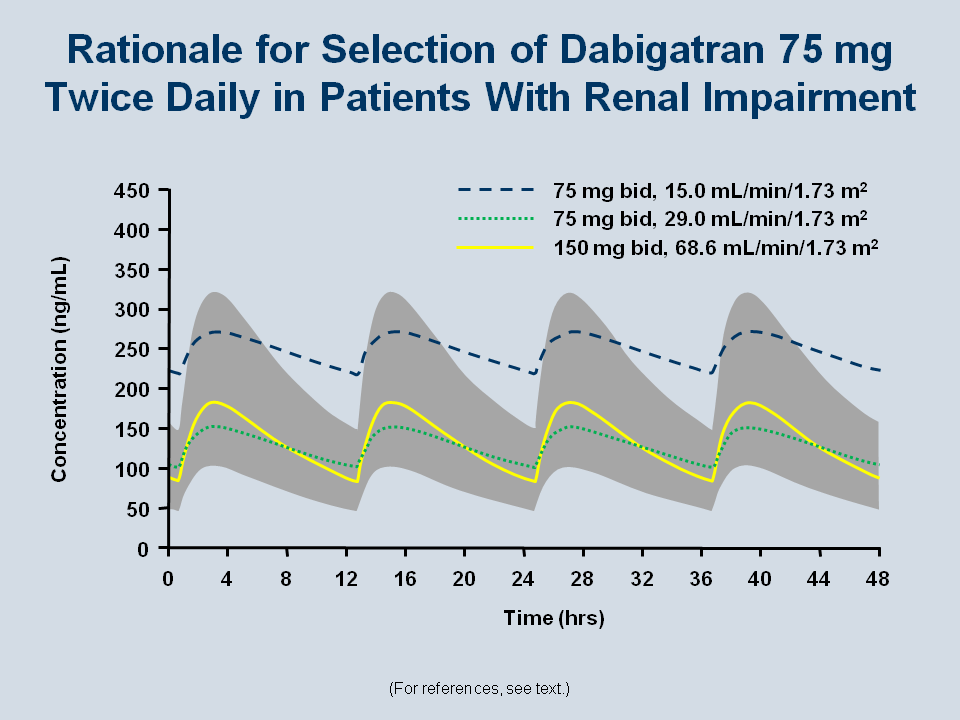
This Figure shows the plasma concentrations of dabigatran for patients with renal impairment.[107] The shaded area of the gray peaks represents the range of dabigatran plasma concentrations in patients with “normal” renal function (mean CrCl of typical RE-LY patients, 68.64 mL/min). The gold curve in the Figure illustrates that dabigatran plasma concentrations at a dose of 150 mg bid fall within this range in patients with normal renal function. At half that dose, 75 mg bid, and half that renal clearance, 29 mL/min/1.73 m2, the green curve shows dabigatran plasma concentrations are still within the range of patients with normal renal function. However, at this same dose of 75 mg bid, when renal clearance falls to 15 mL/min/1.73 m2, the plasma concentrations of dabigatran are too high (dashed curve).
Reiffel JA. Am J Med 2013; 126: 00-00.
[107] Lehr T, Haertter S, Liesenfeld KH, Staab A, et al. Dabigatran etexilate in atrial fibrillation patients with severe renal impairment: dose identification using pharmacokinetic modeling and simulation. J Clin Pharmacol. 2012;52:1373-1378.