Dreher - Figure 11
2. Positive Pressure Ventilation Trial
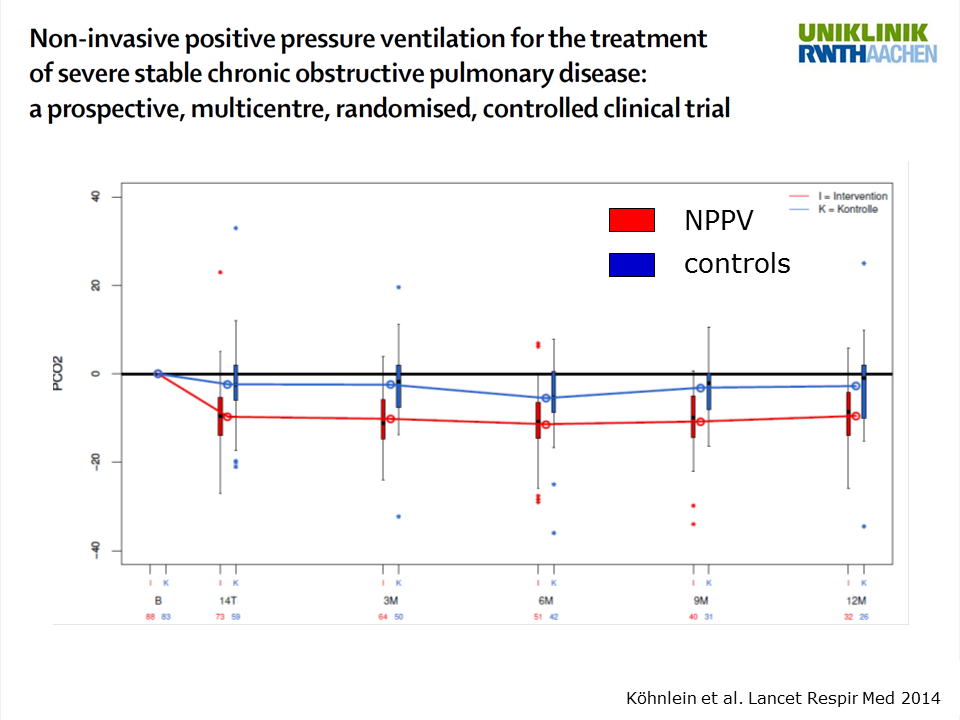
Here you see the change from baseline regarding PaCO2 values over time.[5] The blue line represents the control group receiving standard treatment and the red line represents patients being treated with HMV. It is clear that CO2 was reduced significantly more in the group receiving HMV compared with the control group.
Dreher M. Chest 2017:00.
References
[5]
Köhnlein T, Windisch W, Köhler D, et al. Non-invasive positive pressure ventilation for the treatment of severe stable chronic obstructive pulmonary disease: a prospective, multicentre, randomised, controlled clinical trial. Lancet Respir Med. 2014;2:698–705. doi: 10.1016/S2213-2600(14)70153- 5.