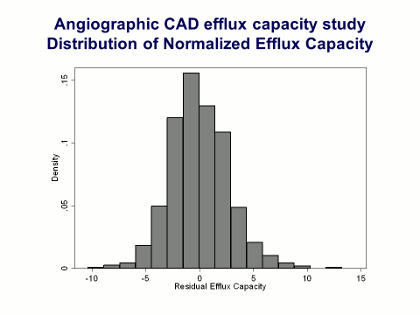
Rader - Figure 10 - Efflux capacities are normally distributed Text
This Figure shows the distribution of the efflux capacity normalized over time, in order to allow for comparison across plates. As can be seen, there is a normal, bell-shaped distribution curve of the residual efflux capacity.
The key question we wanted to ask with this experiment was whether efflux capacity was related to the presence of angiographic coronary artery disease (CAD), and whether this measure was independent of the HDL cholesterol and apoA-I values.
J Clin Lipidol. 2011; 5(6).