Reiffel - Atrial Fibrillation and Stroke: Epidemiology - Figure 25
Impact of High Risk Factors
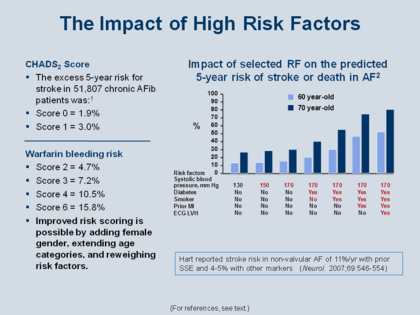
This Figure shows the impact of increasing number or severity of risk factors on increasing risk of stroke or death. On the right the histograms show the increasing risk with increasing number and severity of the risk factors, and the light-blue vs dark blue bars show the increased risk at age 70 years vs 60 years respectively.
The left of the Figure shows the 5-year risk for stroke (in percent of patients at risk who have a stroke each year). It can be seen that the %-risk is about 2.5 times the CHADS2 score (i.e., for a CHADS2 risk score of 2 or 2.5 the risk is almost 5% to almost 6% per year, which is particularly high).
On the other hand, the risk of bleeding while on warfarin occurs at a CHADS2 score between 1 and 2 (i.e., a risk score between 3% and 4%). This is why (as we will see more about later) the guidelines recommend warfarin for elevated risk, but conversely recommend antiplatelet therapy with aspirin for lower risk (CHADS2 ≤1) patients.
Reiffel JA. Am J Med 2013; 126: 00-00.